Unpacking tips
Identify packed samples
Review sections
High entropy
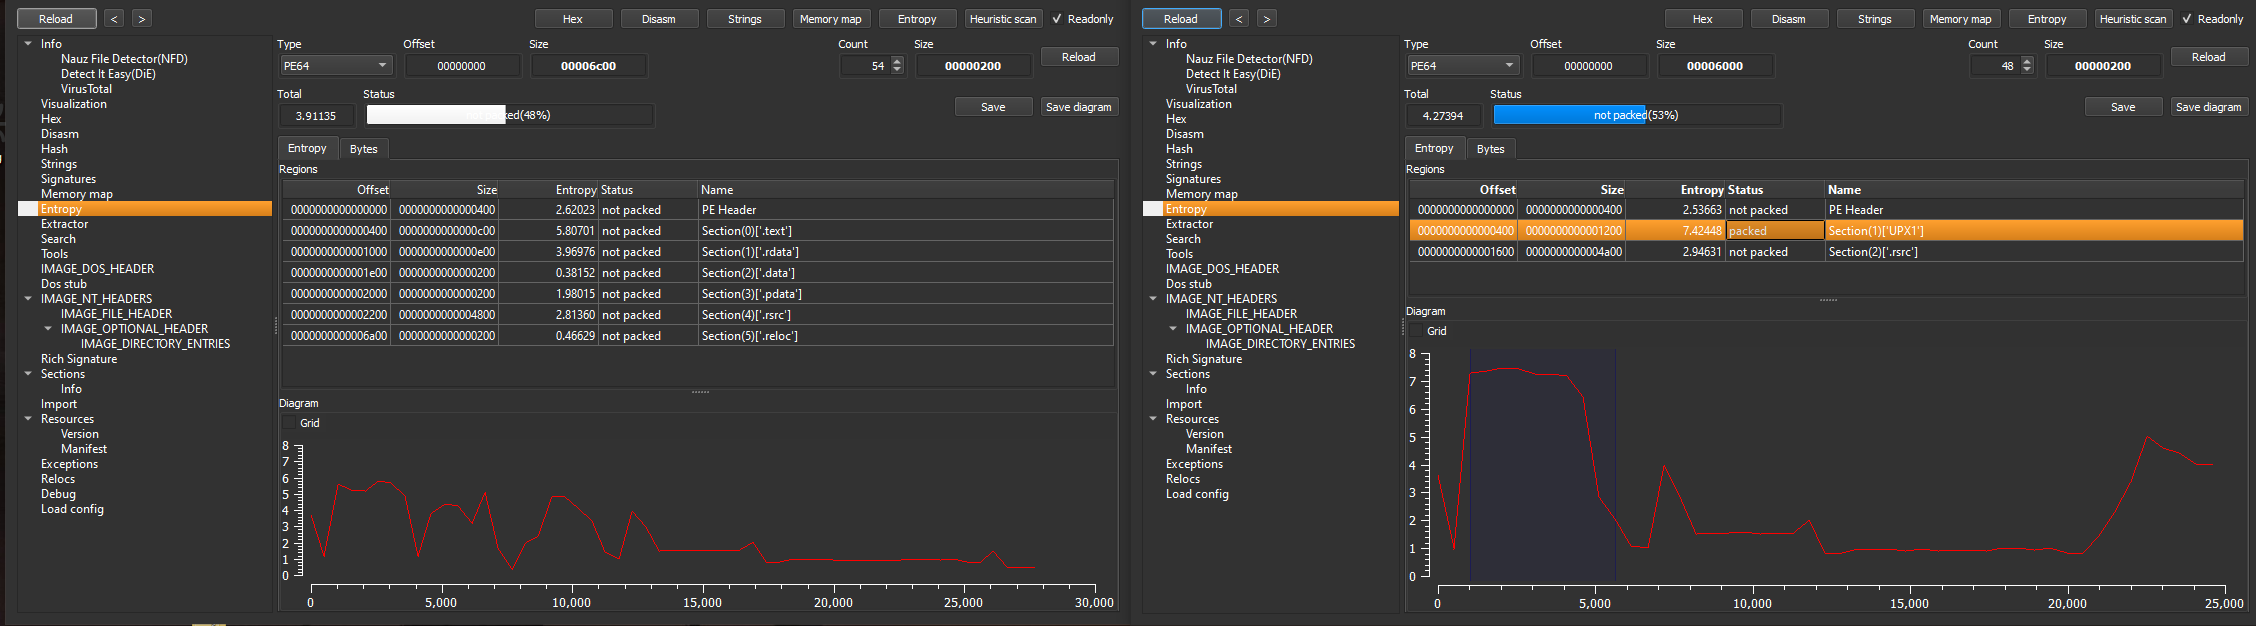
Entropy measures the randomness and complexity of the data. Encrypted and compressed data will resut in a high entropy, which helps to identify packed data.
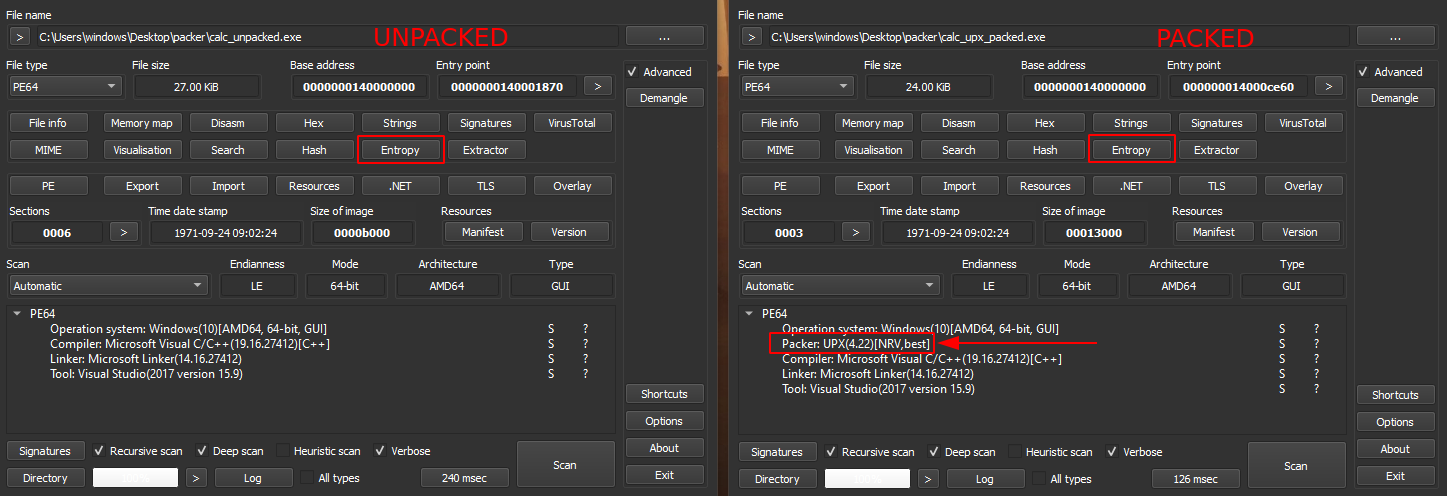
If we take a simple example by packing calc.exe with the famous UPX packer, we can compare entropy between both samples.
With Detect It Easy (DIE), we can see it recognizes the usage of UPX:
If we compare entropy, a section has a very high entropy (above 7.0) in the packed sample:
You can also check section’s entropy with Pestudio:
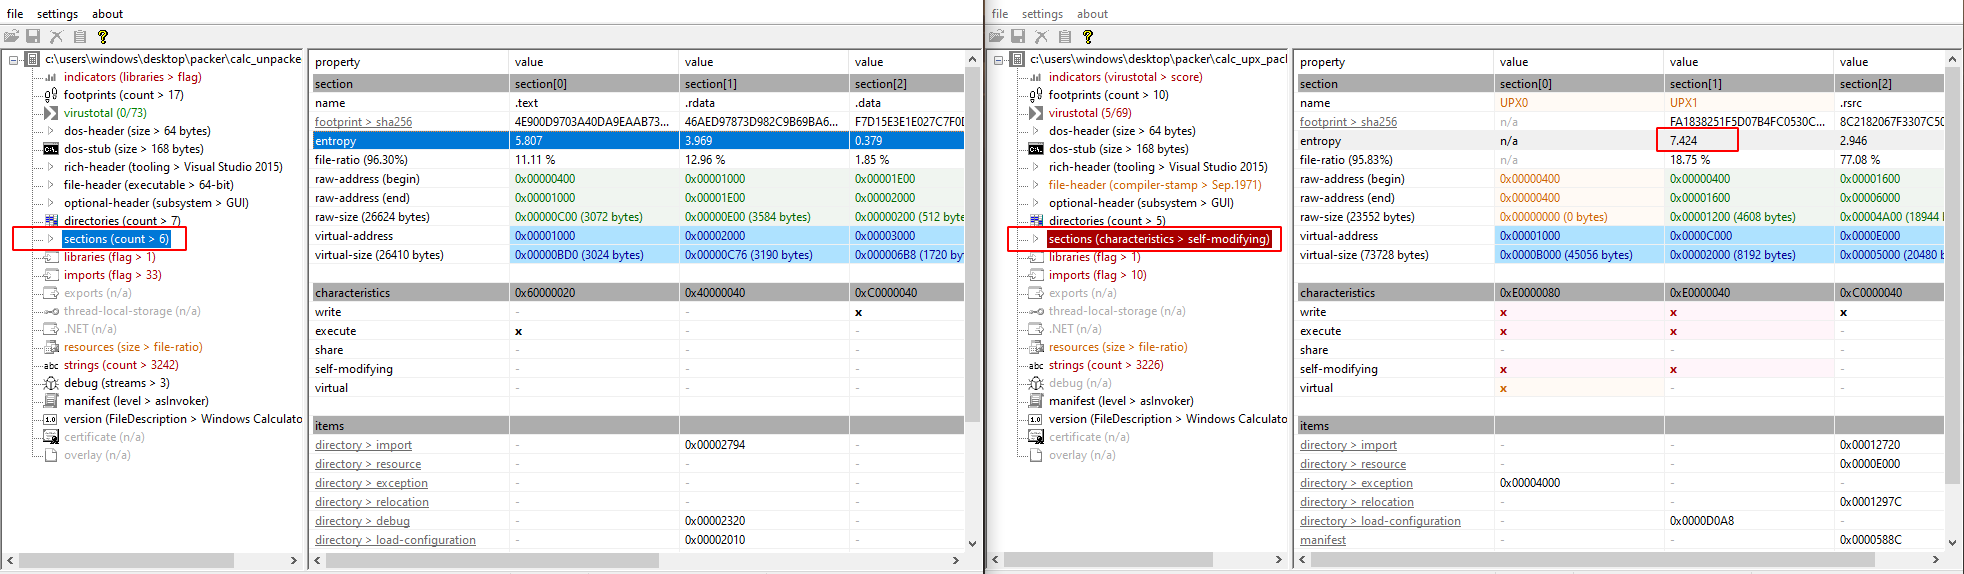
Absence of standard sections and usage of custom one
In the example above we can also see some standard sections are missing and custom ones are used, this can also be useful to identify packer.
Differences between raw and virtual sizes
To compare sections sizes between raw and virtual, one very useful tool for this is PE-bear, which also provides a visualization:
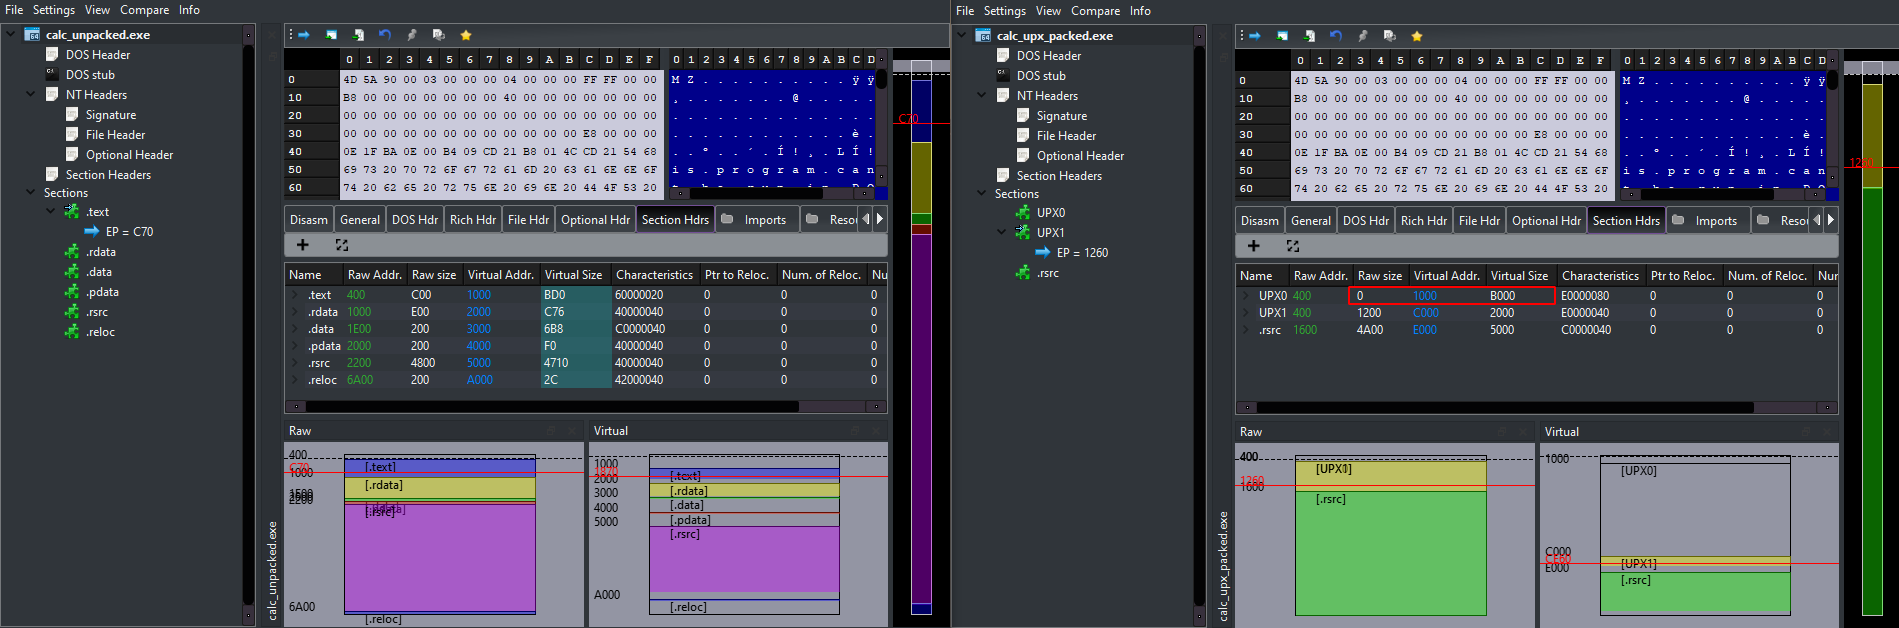
Here the fact that a section has a raw size of zero but a consequent virtual size is very suspicious for the presence of a packer.
Review Imports
No imports at all
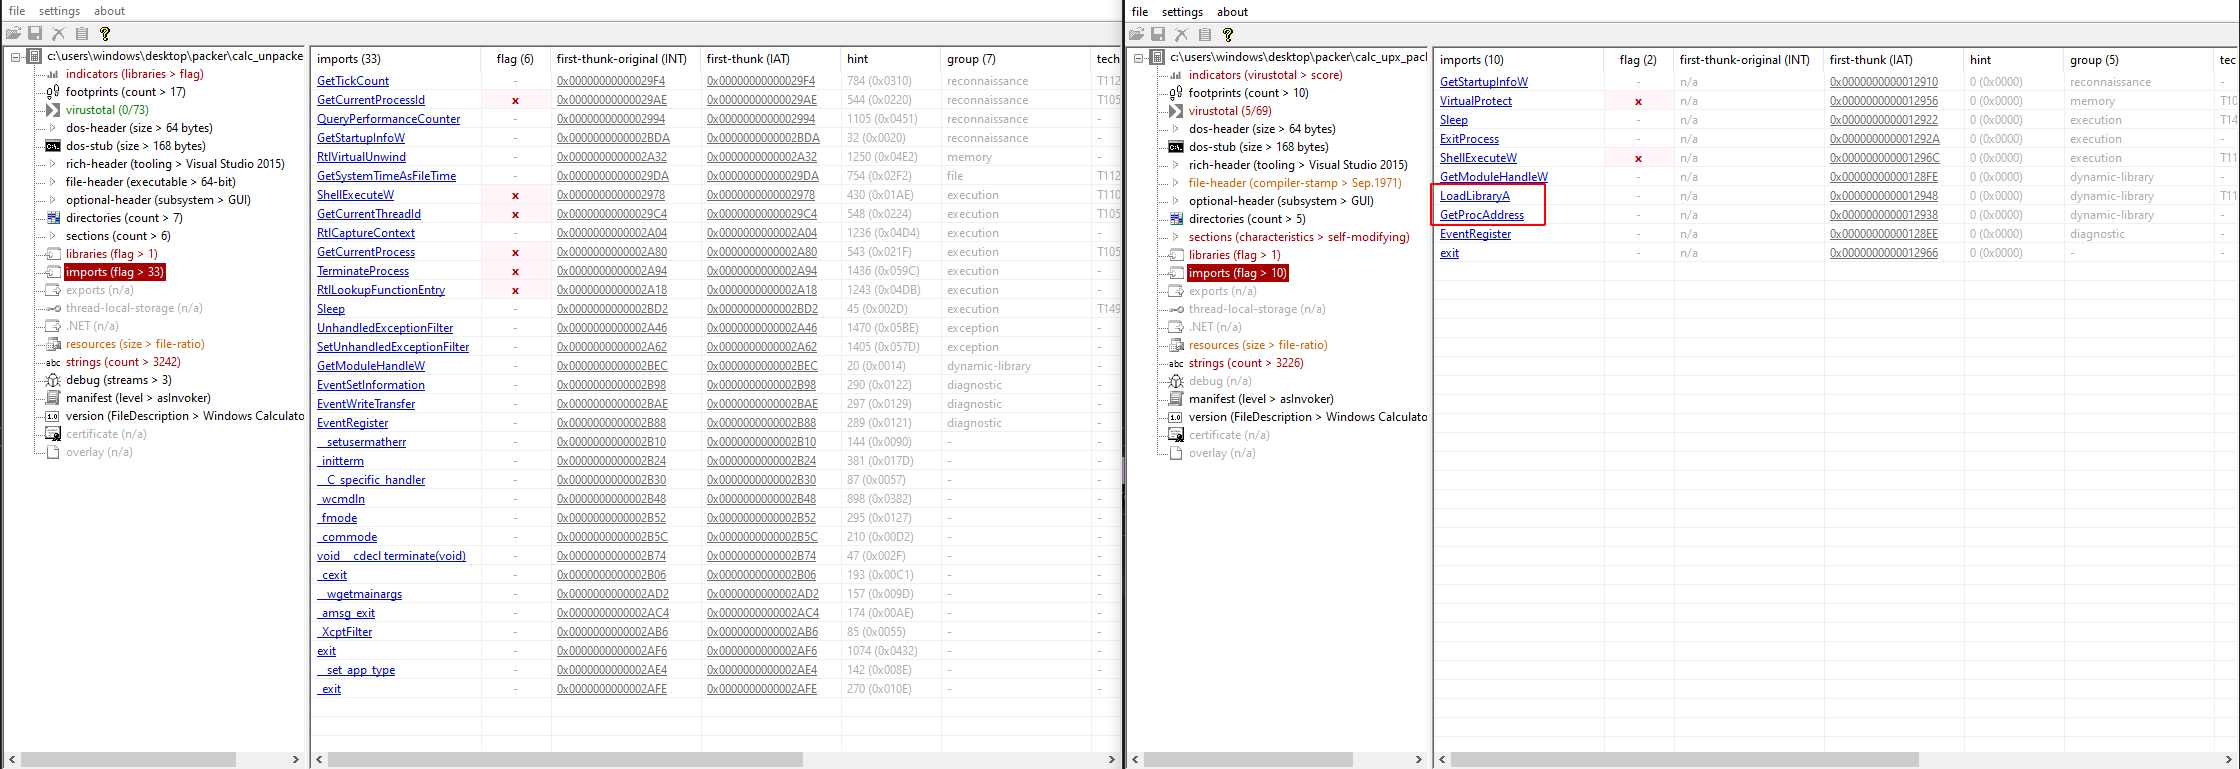
Small number of imports and presence of both
LoadLibraryandGetProcAddress(common APIs used to resolve imports)
Example:
Imports differences between packed and unpacked sample Absence of imports related to executable functionalities based on dynamic analysis or expected behavior (like networking, encryption related functions)
Dump from memory after specific API calls
The idea is to dump executables from memory once unpacked. To do so, we can put breakpoints on specific API calls made in the packer and retrieve the unpacked PE file by monitoring memory region of addresses used by those API calls. What will be monitored will depend to each API call.
x64dbg command prompt, you can use the bp command to put a breakpoint on specific API calls like for example: bp VirtualAllocTo understand what to monitor for each API, we need to review the official Microsoft Documentation and identify the interesting argument or returned value.
VirtualAlloc
For example, for VirtualAlloc, as per the Microsoft Documentation:
If the function succeeds, the return value is the base address of the allocated region of pages.
When we encounter this API call, we will be interested in the value in the EAX register, which contains the return value when the function is finished.
In x64dbg, after hitting a breakpoint on VirtualAlloc:
- Click on Execute till return
- Right click on EAX register and Follow in Dump
- Continue execution until a file is written into memory
- In the Dump window Right click on the beginning address of the PE file (where there is the
MZmagic byte or0x4D5Ain hex) and Follow in Memory Map - In the Memory Map tab, the cursor will already highlight the good address, right click on it and Dump Memory to File
ProcessHacker to perform the dump.VirtualProtect
Again as per Microsoft Documentation, the interesting address when a call is made to VirtualProtect is the first argument:
| |
In x64dbg, after hitting a breakpoint on VirtualProtect:
- Right click on the address of the first argument, the address located at
[esp+4]in the stack window and then Follow DWORD in Dump - Check in the Memory Map if the address points to a legitimate library. If it does, it is not worth digging further.
- Check permissions added, especially execution ones: the new protection is the 3rd argument when the call is made, located at
[esp+C]on the stack window - Dump the related memory region
Identify execution transfer
Once the code is unpacked in memory, the control needs to be transferred to it’s entry point to begin execution.
Multiple memory allocations with a PE file structure being written to them can happen, some of them can be legitimate like for example some dlls being loaded and some can be decoys for obfuscation purpose. One way to identify the correct unpacked PE file is to find when the execution is transfered to it.
One common way is to search for jmp EAX after PE files are written to memory. If you find it, take the jump and dump the memory region related to the address stored in EIP.
If the transfer is not straightforward, you can look into other jmp or call instructions that would then jump into an address within the memory region of one of the unpacked code that you identied.
References
- Book - Practical Malware Analysis: The Hands-On Guide to Dissecting Malicious Software by Michael Sikorski
- Zero 2 Automated reverse engineering course
- Unveiling custom packers: A comprehensive guide